Learn Python for Data Analysis
INTRODUCTION:
Python is an interpreted, object-oriented, high-level programming language. It is simple to learn and code in. It also has a large variety of libraries that are useful for analytics and complex calculations.
Python has become a well-known programming language in the field of data analysis. Because of its remarkable library selection, scalability, and flexibility, Python continues to be the preferred option.
The largest companies in the world are looking for data analysts, as data analysis has become one of the highest-demand careers globally.
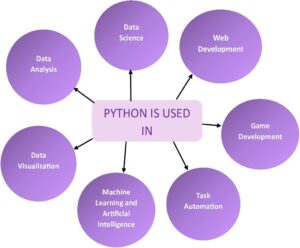
Python provides modules and packages, improving program flexibility and code reuse. Python has applications across many sectors including:

DATA:
A collection of information obtained through measurements, study, analysis, or observation is called data. Data in digital format can be processed and transferred. Data is in many forms of information that are often formatted in a specific way. Data could be in any form, some types of data are geographical, cultural, scientific, financial, natural, transport, statistical, and meteorological data.
DATA ANALYSIS:
Data analysis is the process of obtaining insights from data to help make better business decisions.
Data analysis means investigating, cleansing, changing, and organizing data to gather information and help in decision-making. Being a data analyst, you will analyse huge data sets, find hidden patterns, and convert numbers into useful information.
It is the systematic application of statistical and/or logical tools to explain and show, condense conclude, and evaluate data.
It can take many forms, depending on the question you’re going to answer. We can say that there are four different types of data analysis:
- Descriptive Analysis
- Diagnostic Analysis
- Predictive Analysis
- Prescriptive Analysis
DATA ANALYST:
A person who collects and evaluates data to address a particular issue is known as a data analyst. In addition to spending a lot of time with data, the profession also requires communicating findings.
A data analyst examines data to discover critical insights about a company’s consumers and how the data may be used to address problems. They also share this information with company leaders and other stakeholders.
Here we can summarize the work of a data analyst in a simple way using a diagram:

A data analyst is someone who has the skills and knowledge to transform raw data into information and insights that can be used to make business choices.
There are many types of data analysts in this tech world. We want to list a few of them below:
- Business Analyst,
- Business Intelligence Analyst,
- Operations Research Analyst,
- Medical and Health Care Analyst,
- Market Research Analyst
- Quantitative Analyst,
- IT System Analyst,
- Financial Analyst, …. many more.
STEPS TO BECOME A DATA ANALYST:
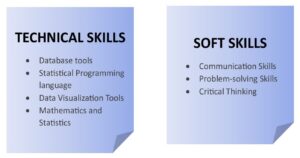
If you want to become a data analyst, you must understand the two most significant skills: technical skills and soft skills. Let’s briefly explore the technical skills required to become a data analyst.

Technical Skills:
If you want to learn more about the data analyst’s technical skills, continue reading a few sentences. You have focused on the crucial four abilities needed for a data analyst.
- Database Tools:
SQL is commonly used for data analysis in large businesses and is considered one of the most crucial tools for analysts. SQL is also used by software developers for software development.
It is a common choice among data analysts since the code is easy to read and understand. It can also be used to modify and update data.
On the other hand, we have to learn Microsoft Excel for data analysis. The most important application for a data analyst to learn is Excel, which is the industry standard for data analysis.
With built-in pivot tables, they are without a doubt the most popular analytic tool available. This all-in-one data management tool makes it simple to import, analyze, clean, evaluate, and display your data.
- Statistical Programming Language:
Learning a statistical programming language, such as Python or R, will allow you to modify enormous amounts of data and solve complex equations.
We recommend you choose the programming language which is Python because Python is versatile and it is easy to learn and code.
When it comes to data analysis, Python is an accepted standard in fields like math, business, science, and engineering.
Popularity among data analysts is due to its flexibility, broad libraries, and simple syntax. Python’s ability to rapidly generate and manage data structures is one of its most popular uses.
Its dynamic typing and dynamic binding, along with its high-level built-in data structures, make it an excellent choice for data analysis.
- Data Visualization Tools:
The process of graphical data representation in the form of heat maps, charts, infographics, sparklines, geographic maps, or statistical graphs is known as data visualization.
You may easily communicate your findings to others by creating interactive charts, graphs, and dashboards with the use of data visualization tools such as PowerBI and Tableau.
PowerBI is an excellent choice for data visualization because it is simple to use and connects easily with other Microsoft products.
This makes it an excellent tool for companies that use Microsoft Office. Tableau is another popular alternative, with a large user base and a diverse set of capabilities.
By learning a data visualization tool, you will be able to produce interactive and fascinating visuals that will assist you in better understanding your data and communicating your results to others, making you an important asset to any data-driven company.
- Mathematics and Statistics:
Understanding the fundamentals behind what data tools do can greatly benefit your business. An in-depth knowledge of statistics and math can help you choose which methods are most suited to solving a certain problem, detect mistakes in your data, and better understand the results.
Understanding statistics is being able to sort through large amounts of data to extract high-level insights. Probability distributions, statistical characteristics, and Bayesian statistics are among the most common statistical topics to understand.
CONCLUSION:
In short, data analysis is a great career path with high demand and exciting chances. Data analysts play a crucial role in collecting, analyzing, and communicating insights that drive informed business decisions. Whether you’re just starting or wishing to improve your career, mastering abilities in mathematics, statistics, and data technologies is important. As we complete this comprehensive guide, it is clear that the demand for professional data analysts continues to increase, creating a landscape full of opportunities for those prepared with the necessary expertise.
Recent Posts
Categories
- All
- Angularjs training in Chennai
- ASP.NET Core
- dot net training
- dot net training in chennai
- dotnet full stack developer
- Free dotnet training
- information on dotnet
- Learn Java in chennai
- Learn Python at Karaikudi
- learn python online
- learn python online from chennai
- Linq Queries in .net
- mutual funds
- MVC Training Tutorials
- PHP Training in Chennai
- pmp training online
- power apps online training
- Python Training Online
- share market
- Sharepoint framework online training
- SharePoint Freelancers in Chennai
- software testing
- spfx online training
- Stock market
- Uncategorized
